Methodology Framework

Introduction
The effects of noise on the world, and our views of the world, are profound. Noise in the sense of a large number of small events is often a casual factor much more powerful than a small number of large events can be. Noise makes trading in financial markets possible, and thus allows us to observe prices for financial assets. Noise causes markets to be somewhat inefficient, but often prevents us from taking advantage of inefficiencies. Noise in the form of uncertainty about future tastes and technology by sector causes business cycles and makes them highly resistant to improvement through government intervention. Noise in the form of uncertainty about what relative prices would be with other exchange rates makes us think incorrectly that changes in exchange rates or inflation rates cause changes in trade or investment flows or economic activity. Most generally, noise makes it very difficult to test either practical or academic theories about the way that financial or economic markets work. We are forced to act largely in the dark.
Fischer Sheffey Black

The most important principal of our Methodology is to take decisions based on accurate infomation.

Information Asymmetry Model

Any forecasting system is based on data that have received in the past and depending how sophisticated is the forecasting system is trying to predict the markets movements, based on present data. The financial markets are moving in a wave-pattern style, where there are 3 major trends: uptrend, downtrend and sideways. While, the upwards and downwards trends can be under circumstances very profitable the sideways trends (consolidation pattern) may have as result significant capital losses.
Most of the trading systems and known algorithms are using time series analysis for sampling (i.e. receiving past events every 1 minute, or every 1 hour, or every 4 hours, or any other time interval the trading system needed). The main problem with this approach, is that the system receives these past events every x-time interval, even if the price or the volume of the asset are almost unchanged, or even worst there was big price movement.
If we sample historical data based on constant time intervals we undersample when there are very active periods of trading and oversample when there are periods with low activity.

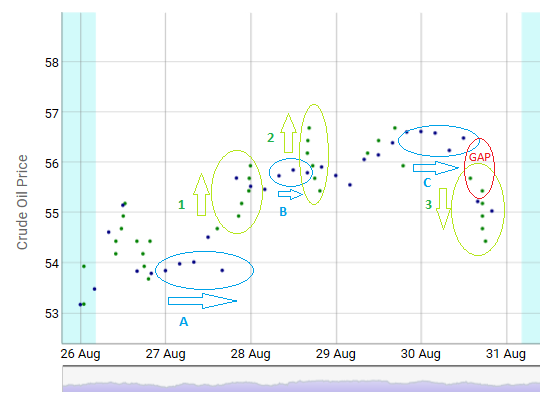
The approach that we are using in UNIDAX is totally different, in the way that our trading system is sampling based only on real vertical (up or down) price movements, when there is an unusual imbalance of buying/selling activity, which may indicate information asymmetry between market participants. The underlying principle is that, the informed traders either buy or sell in large quantities, but rarely do both at the same time. Sampling when imbalance events occur allows us to focus on large (vertical) moves and ignore less interesting periods. With the information-driven approach we can sampling data, unspecified time-intervals per week or day depending the price movement volatility (from once time per day until many times). During periods that markets are calm we do not need to take sample for these specific periods at all. There are even periods where we need to take sampling only once a week (during periods with low volatility and sideways trends).
As we mentioned in the previous section, we are sampling based on real vertical price movements. Our methodology considers a real price movement when the price and the volume passes two predefined thresholds (one for the price and the second one for the volume) from the previous sampling. If the price continues to the same direction as the previous sampling and passes the thresholds, then the system it takes a new sample. In case that, the price changes to opposite direction then the thresholds are multiplied by a factor of 2 or 3 and only if the price and the volume passes the multiplied thresholds the system takes a new sample. The factor of 2 or 3 is used to eliminates random markets movements (noise).

How the thresholds are calculated?

This is the most important phase of our methodology. This phase using linear optimization tries to find the optimum solution based on the idea that we must exclude the sampling during horizontal price movements and considering only the periods with vertical movements. The optimum solution is different for each financial asset and it is depending from the asset structure, the past volatility and from the trading plan (long-term or short term) we want to build.(In Statistics section there two real trading cases, one with medium-to-long term strategy and another one with short term strategy).


In conclusion, the information-driven approach helps the next steps of our methodology since our input data, are filtered out from market noise, in a significant level.

Algorithmic Model Description

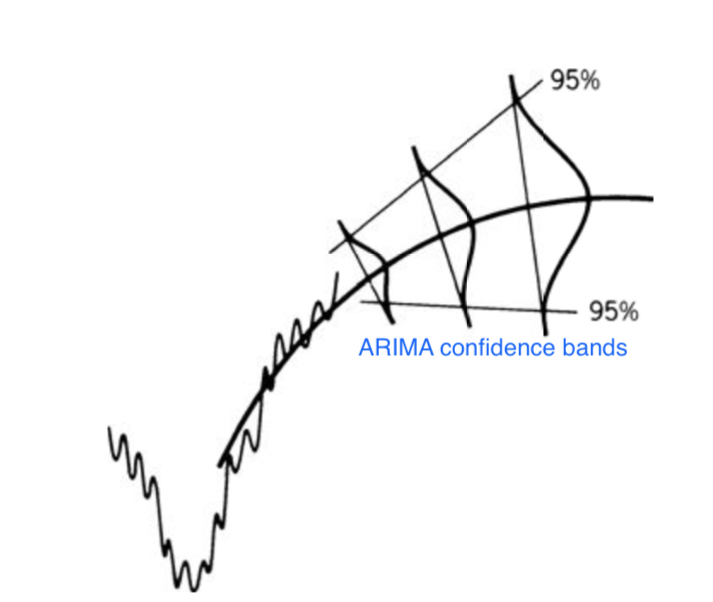
A major part of our methodology is a Hybrid version of ARIMA (Autoregressive Integrated Moving Average) model. The following sections describes the Hybrid ARIMA differentiations from a standard ARIMA model.
An ARIMA model is created by a process of repeated regression analysis over a moving time frame, resulting in a forecast value based on the new fit. An ARIMA process automatically applies the most important features of regression analysis in a pre-set order and continues to reanalyse results until an optimum set of parameters or coefficients is found. This technique is often referred to as the Box-Jenkins forecast. The two important terms in ARIMA are autoregression and moving average. Autoregression refers to the use of the same data to self-predict (not using of external variables). Moving average refers to the normal concept of smoothing price fluctuations, using a rolling average of the past n-periods.

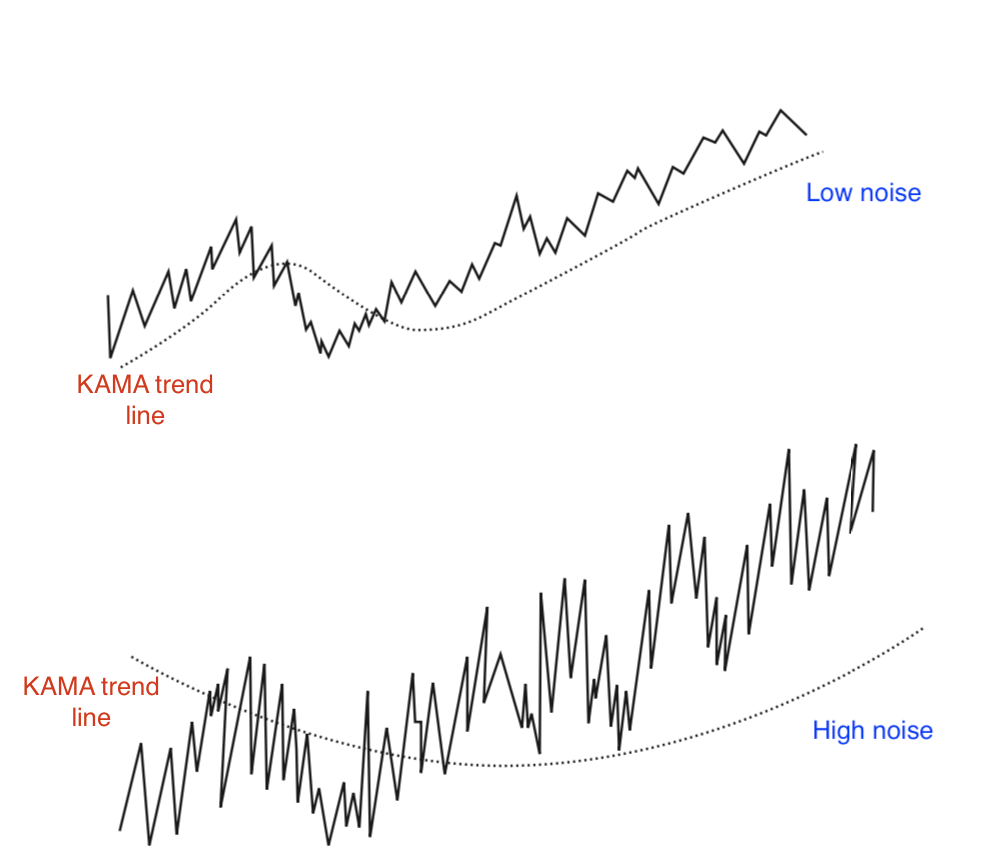
Our ARIMA model uses the Kaufman’s Adaptive Moving Average (KAMA) and not a simple or an exponential moving average like EMA. KAMA is based on the concept that a noisy market requires a slower trend than one with less noise. The assumption in KAMA is that during a relatively noisy price move, the trendline must lag further behind to avoid being penetrated by the normal but erratic behaviour of prices, which would cause an unwanted trend change. When prices move consistently in one direction with low noise, any trend speed may be used because there no false changes of direction. KAMA is designed to use the fastest trend possible based on the smallest calculation period for the existing market conditions. It varies the speed of the trend by using an exponential smoothing formula (therefore, it is not a “moving average” as the name says), changing the smoothing constant each period. The use of a smoothing constant was selected because it allows for a full range of trends, represented as percentages. In our model KAMA is sampling based on information-drive price movements, excluding the time factor.

While a standard ARIMA model is based on time series sampling, we formed a Hybrid ARIMA based on information-driven price movements excluding in any way the time factor. Moreover, the moving average calculation is based on KAMA and not to a simple moving average. With this way, KAMA is used as an additional final noise-filter.
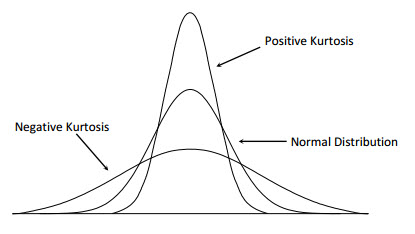
Kurtosis is a price distribution measurement which return an unbiased assessment of whether the prices are trending or moving sideways. If the prices moving steadily higher or lower, then the distribution will be flatter and cover a wider range. This is call negative kurtosis. If prices are rangebound, then the frequency will show clustering around the mean and we have positive kurtosis. Kurtosis is mainly used in our methodology as trading confirmation (Negative Kurtosis is required for the confirmation)

UNIDAX trading framework INFAS is mainly based on the combination of the Information Asymmetry Model and the Hybrid ARIMA process.

Information-driven Sampling vs Time Series Sampling Crude Oil
The chart shows the Information-driven sampling vs 4 hours sampling for Crude Oil. For the same period of 40 months sampling, the trading system took 5085 signals in case of information-driven analysis and 5334 signals in case of time analysis with 4 hours intervals. The main difference is that with the second approach the system is doing “under-sampling” during vertical price movements and “over-sampling” during horizontal price movements. In opposite, our trading framework is doing sampling only when it is needed.